
Cassie McBride at Ammo.com runs the numbers, and produces this intriguing little chart (among others):
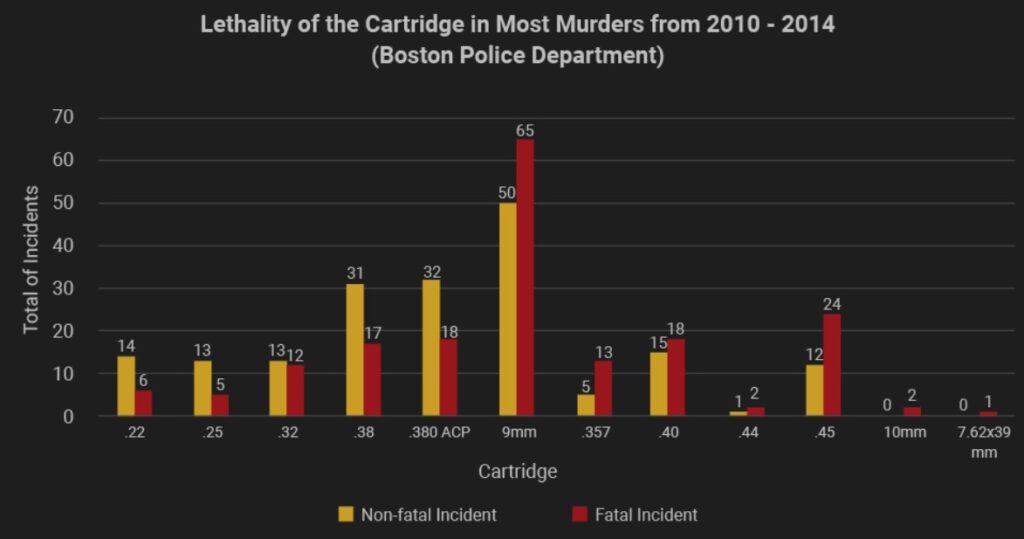
The only issue I have is that there’s no mention of whether the lethality was affected by the number of boolets per fatality — i.e. how many died as a result of being shot more than once. Whatever, I’m pleased to see a tidy 2:1 ratio for the .45 ACP and likewise for the .357 Mag, albeit from a lower base. (I know, these are murders, not Righteous Shootings. But given the source, I don’t think the fuzz would make a distinction anyway.)
But wait: surely Massachusetts’s strict gun laws should make any murders unlikely or even impossible? Or are they telling us that all the above murders were committed by licensed gun owners only? [/sarc]
Browse the whole article for full reading pleasure.
A .22 to the eyeball will bring even an elephant to it’s knees.
It ain’t about the size, and never was.
McBride includes a link to the original study. It shows a little info about single vs multiple wounds and about wound location. Result are about as expected. Multiple wounds increase lethality. Wound location has large effect: multiple head/neck wounds most lethal, single head/neck wound more lethal than multiple chest/back/abdomen wounds, arm/shoulder/leg wounds rarely lethal.
I wonder if those more competent and familiar with handguns are choosing 45 & 357 and those less familiar are just grabbing whatever thus skewing the results
A better title for this graph could be THE MOST COMMON CALIBER USED IN DEADLY SHOOTINGS.
That was my thought too. It’s really just a chart of what the mostest favoritest cartridge is for Boston. And apparently no one there loves the little bitty 5.56 poodle shooter at all. Or else the AWB really really works. The 9 mm and it’s kissing cousin, the 9 mm short (aka .380 acp) are top of the heap for Boston. I’m a little surprised by the 32 and 25 on the list, unless people have been hoarding a bunch of those Jennings crap pistols for just such an event as this.
This is a very poor presentation of data. The chart title is “lethality of the cartridge in most murders” but it shows non-fatal incidents. Doesn’t murder, by it’s very definition, mean “fatal”? Also, as Kim mentions, there is the huge factor of number of shots, to say nothing of what exactly “most murders” means. Looking at the chart one could say that 10mm and 7.62×39 are 100% fatal. “OMG! Our data shows that these 2 calibers kill everyone! We have to ban them as a matter of public safety!”
I think you have to weight the chart, since 9mm is way more popular amongst the indigenous urban population.
Also much more likely to fit into the “spray & pray” mentality. Cuz who wants to waste expensive ammo in a drive-by.
To your point:
Headline: One killed, 27 wounded in shooting spree where more than 90 shots fired at street party; suspects still at large.
= shooter(s) are black
Headline: 11 killed in shooting rampage, 15-17 shots fired, alleged shooter kills self.
= shooter is white
Its the systemic racism in our society.
Meaningless stats, to make what point? None, as far as I can tell.
interesting presentation for the unlettered public, but a highly ineffectual use of questionable data
My EDC is a 10mm. It is 1 mm better than a 9.
Dunno if it just me, but looking at that chart I simply see the distribution curve of the most used caliber on the market being the 9 mm, hence the most “deadly” by statistics. If everyone carried a .45, the chart would shift to that high point.